
May 19, 2014

As performance coaches, our relationship to our athletes’ on-field performance can be a little convoluted. Unlike sport coaches, we do not have a direct impact during games, races, or matches. If our athletes or teams perform well, it’s easy to take some credit for the athletes being stronger, faster or more well rested. On the other side of the coin, when our athletes and teams don’t do so well, it’s just as easy to hide behind those same performance markers. Many times during our years in collegiate athletics we heard a fellow strength and conditioning coach say something like, “We got blown out over the weekend… I don’t know what happened, the team looked good… it wasn’t my fault.” To some extent we agree, of course a bad loss wasn’t one person’s fault. We also know how little job security strength and conditioning coaches have in the competitive world of sports. Too many times we have seen colleagues unfairly let go after a bad season.
We believe this has a large impact on the types of analytics that exist in much of the performance world today. Strength and conditioning coaches test their athletes 10 yard sprint time, 1Rm bench press and long jump distance not only to see how their athletes have improved, but to prove that they are doing their job well. Logically, if the athletes improve in those measurements after a season of training then that strength coach did all they could to help their athletes get better. If they also happened to not win very many games or races, it wasn’t his fault.
This is where we start to disagree with that logic. Your job as a performance coach is not only to help your athletes get stronger and stay healthy, but to help them get better on the field. If it’s not, you need to re-evaluate your thinking. So when it comes to testing, we place a lot of emphasis on the idea of validity. Statistical validity is the extent to which a measurement is well-founded and corresponds accurately to the real world. The validity of a measurement tool (for example, a sprint test) is considered to be the degree to which the tool measures what it claims to measure. So, when you’re athletes improve their 10 yard sprint time, all it proves is that they got better at 10 yard sprint. Without an additional study that compares 10 yard sprint to on-field performance, we can’t prove that improving it will make you a better football, soccer, or basketball player. The other problems we have with traditional testing is that it is time consuming and distracting. Test days take a lot of time away from actual preparation, and because all athletes are competitive they put at least some investment in getting better at the test. That opens up the possibility for injury from overreaching, and disappointment if they don’t improve their score.
At SPARTA we spent a lot time perfecting the scan that produces our athletes’ Sparta Signatures. The scan itself takes less than 5 minutes, so it never detracts from the actual training session. And because the Signature tests the quality of movement (as opposed to quantity), the athlete is not trying to achieve a personal best, only to see how their Sparta Signature has changed since the last scan. This greatly reduces the chances of injury and disappointment.
The other extremely powerful thing about the Sparta Signature is that it can be directly correlated to on field performance. In science and statistics, correlation refers to the statistical relationship between two variables or two sets of data. The statisticians we work with have found some groundbreaking relationships between changes in the Signature and performance on the field. It is groundbreaking because no study has ever significantly associated a 5 minute assessment with the most important single measurement for both an athlete’s health and performance…how much you play the game.
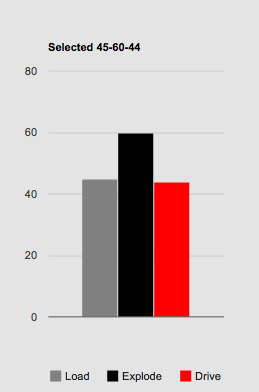
For example in Men’s basketball, there is a 0.716 correlation between minutes played and the combination of increased EXPLODE (concentric force) and decreased LOAD (eccentric rate of force) in the Movement Signature. An example of that Movement Signature is seen to the right. In practical terms, that means that athletes who can maintain stiffness (EXPLODE) without the need for large counter movement (LOAD) make for healthier, better basketball players.
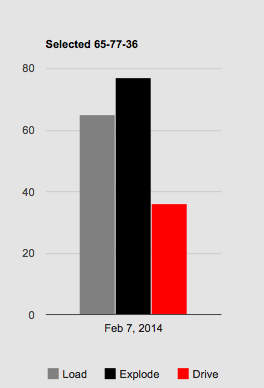
Let’s look at an example in Women’s basketball. We found a 0.76 correlation between increased LOAD and rebounds, particularly as the t scores for other variables decreased (Signature to the right). What this shows once again is that high LOAD is very important for protecting females from injury (especially knee). When you stay healthy and on the court you have a much better chance of contributing.
As coaches, we think it’s healthy and normal to have an invested interest in your athletes’ on-field success. We also believe it’s important to be able to measure the impact you’re training program is having. Choosing valid tests and measures is the best thing you can do to know that what you are doing is making a difference.