
February 11, 2021

The roles of normative, raw, and time-series force plate data. Which type is most meaningful for you?
We are in an era of data explosion. More information is being created now than ever before, which is both daunting and exciting. It is almost like a hospital’s emergency room on a Friday night, incoming situations from a variety of sources with varying levels of usefulness and actionability. Similar to an emergency room that triages patients, how can we better triage all of this data coming into our lives? How can we better understand the type of data and where it best lives in our workflow to maximize our organization’s health?
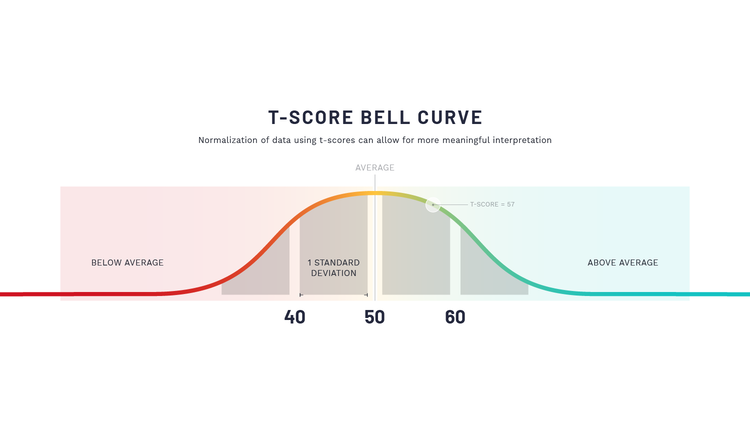
At a high level, we see health & performance data being generically triaged into 3 buckets; normalized metrics, calculated or 'raw' data, and time-series data. Normalized data is like your gunshot wound coming into the ER, the most easily identified and most urgently actionable. Normalized data often arranges the information in a distribution that allows comparison to other individuals and/or to a previous measurement more easily. Probably the most well-known example is a bell curve. Using a standardized scoring system like a T score, 50 would be the mean value for the group being compared against (middle of the bell curve). By normalizing data using T-Scores, organizations can compare values between individuals and across populations using a standardized scale.
The T-Score was first popularized when measuring Bone Mineral Density (BMD) to identify the risk of osteoporosis. The following is an expert from an article discussing the history of the T-Score:
“As bone density technology evolved, it became clear BMD expressed in raw units would be difficult to interpret. Ideally, for BMD measurements to be clinically useful, they should be presented in terms that are readily understandable by patients and clinicians, as well as independent of the densitometer used or the skeletal site measured.”
“Unlike common clinical measurements, such as blood pressure or cholesterol, the accepted normal values for BMD are not generally known. The T-score was suggested by researchers to simplify the interpretation of the bone density result and avoid the use of raw BMD values.” (1)
A standard score is also necessary because it takes into account standard deviations. A T-Score value of 50 represents the mean or average of the population, with 10 T-Scores in either direction (40 or 60) representing one standard deviation away from the mean.
This standard deviation aspect limits the expected noise from raw data, the fluctuations occurring due to the myriad of variables that affect human physiology on a daily basis. Calculated metrics are just that; raw metrics collected directly related to their object of study, which is the statistical units. Examples in health and performance are time (seconds), weight (lbs.), distance (inches), force (Newtons), velocity (m/s), power (watts), etc. For practitioners, there is not much use for raw data, as its primary purpose is fact-checking and research, setting newly standardized scoring, ensuring data collected is calculated correctly, etc.
Interestingly enough, many scientists refer to raw data as cooked data because, the majority of the time, it is processed from what is called “time-series data.” Time-series data is a sequence of data points collected over time intervals, giving us the ability to track changes over time. This type of data can be time-series within a discrete measuring period or longitudinally over longer periods of time like, weeks or months. For this example, we will focus on the former. Think about a jump test on a force plate that gathers data at 1000 Hz (or 1000 points per second). If the jump takes 1 second, you have a force value for every 0.001 seconds. If you want to find your rate of force, then you have to calculate the slope of Force from the start to the desired endpoint. This slope or calculation provides your raw value (cooked) of, let’s say, 6532 Newtons/second. Comparing this raw value to your peers could provide a T score of 60, meaning you are one full standard deviation above the mean.
There is no one way to collect & present data, just comes down to your intent for its use; most practitioners prefer T scores to be immediately actionable to help their athletes & warfighters, while researchers prefer time-series data to perform analysis in a more robust statistical software so they can evaluate every time slice for publication & verification.
None of these data points have ever been able to exist without the other, which is most useful for your role on the team?
References
Faulkner, Kenneth G. "The tale of the T-score: review and perspective." Osteoporosis International 16 (2005): 347-352.
Tag(s):
Data