
August 27, 2019
This week at Sparta Science Training Ground we had meetings to discuss data on all of our exercises and their specific impact on movement, but specifically ground reaction force. These are always fun meetings because our data science team gets to update everyone on the effect of training stimuli on sequencing patterns in order to refine planning and improve outcomes not only internally at Training Ground, but also with our partners. How is it that we can compare data from multiple organizations and individuals across the board? Data Normalization.
What is database normalization?
The normalization of data (which was brought to light in 1970 by Edgar Codd) is the process of structuring a relational database in accordance with a series of so-called normal forms in order to reduce data redundancy and improve data integrity. In other words, being able to understand if change is meaningful or not takes a better process than simply comparing raw values. Take the following example:
When an algorithm is comparing numerical values such as creatinine=3.8, age=1, heparin=5,000, the ML model will give a disproportionate importance and incorrect interpretation to the heparin parameter, just because heparin has a high raw value when compared to all the other numbers. One of the most common solutions is to normalize each column:
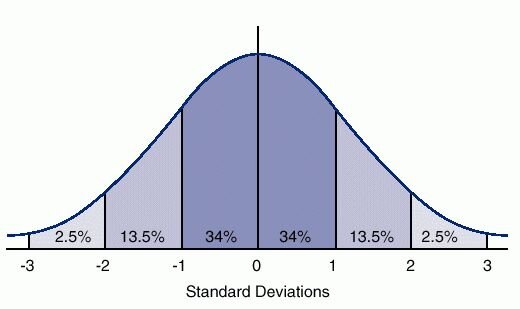
Step 1: Calculate the mean and standard deviation
Step 2: Replace the raw values with the new normalized ones – this is a T-Score.
When normalized, the algorithm will correctly interpret the creatinine and the age of the patient to be the important, deviant from the average kind of features in this sample, while the heparin will be regarded as normal.
Raw data vs normalized
So, going back to our meeting where we are discussing movement improvements via multiple exercises, we can actually see which exercise has more of an effect on specific variables that we measure consistently. To do this we need to collect enough data from across populations to understand the distribution and be able to identify what these norms are (one team is not nearly enough). Although we are comparing an RDL to an overhead squat, we can still see which one had a bigger impact on Drive (concentric impulse) along with other variables – and by how much. This is imperative in understanding the impact of what we do, something everyone should strive for in their programming efforts.
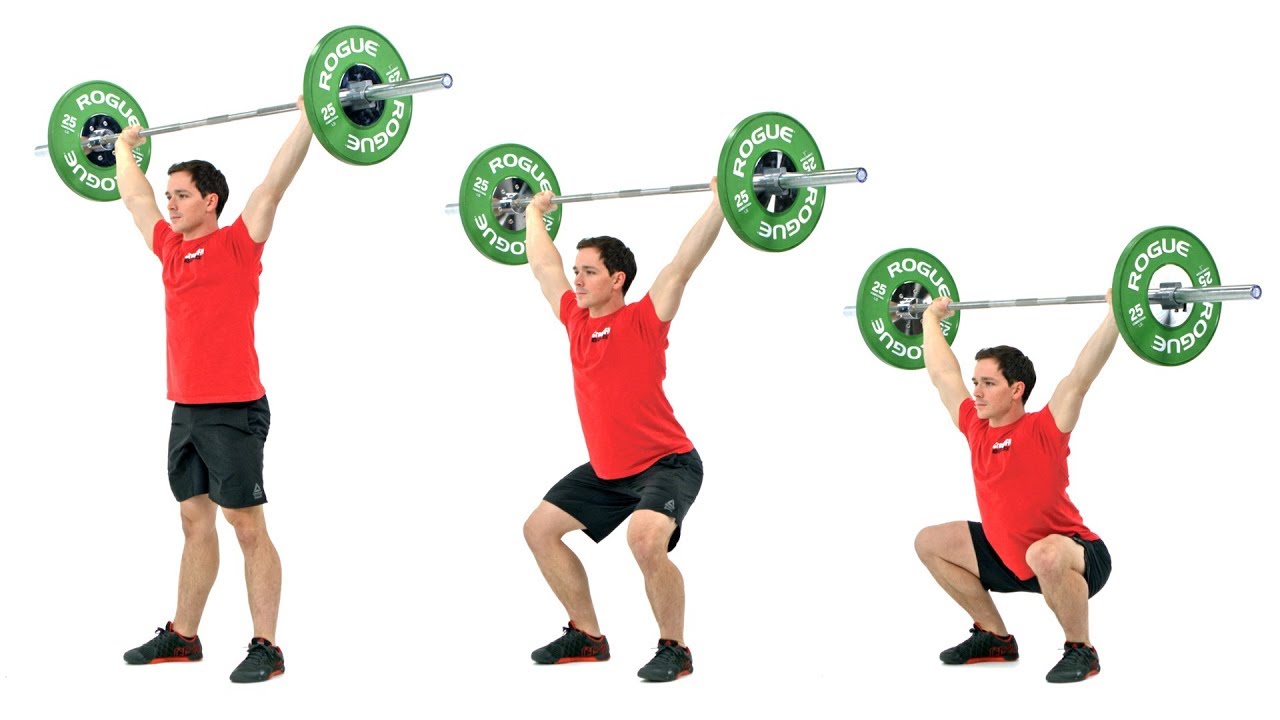
Overhead Squat
While raw data is certainly interesting to gander at, it barely scratches the validity surface in helping the practitioner decide what to do next. When comparing concentric vertical impulse of 5.2 to 6.8 how do we know what threshold is significant? Normalizing the data by calculating the mean and dividing by the standard deviation helps shed light. Continuing to analyze data creates more wasted time that we could be spending with our athletes improving movement qualities. By normalizing data and using T-Scores it helps us to know when change is meaningful we can continue to improve what we implement as practitioners.
Are we scientists or practitioners?
The fact that most of these raw variables have different units and different scales doesn’t affect the ability to interpret the results once normalized, and most importantly quickly relay this information to those who matter most! Stop wasting time digging through hundreds of variables and units – It’s not why we got in this industry.