
April 28, 2014

In a time where change is constant and instant feedback is ubiquitous, how do you convince your athletes that doing the same thing over and over is actually what they need? Evidence based training is at the heart of the Sparta program, but as you’ll come to see, the way we analyze the evidence makes all the difference.
Every Sparta athlete is evaluated with a force plate scan, a test compromised of six vertical jumps. The data collected from the test creates what we call a Sparta Signature for the athlete, which represents how their nervous system works and highlights their strengths and weaknesses. We then create training programs based on the needs of the movement signature and then re-test the athlete to evaluate the effectiveness of those training program prescriptions. The important question to ask is, how can we be sure that it’s our prescriptions that are causing the athletes signature to change? To make sure we are always on the right track we’ve enlisted the help of statisticians from leading universities. They analyze the data we’ve collected from thousands of athlete trials and we work together to improve our prescriptions. One of the key concepts we have taken from our work with the statisticians is the idea of trajectory.
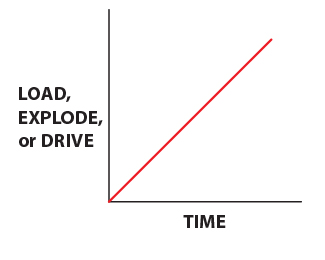
To understand the idea of the trajectory you have to first understand the idea of time series data(also called longitudinal data). A time seriesis a sequence of data points typically measured at uniform time intervals. The key for us and our athlete is that these data points are measured over time. Most research conducted on athletes analyzes cross-sectional data. Cross-sectional data differs from time series in that it is collected by observing many subjects at the same point in time, or without regard to time differences. Analysis of cross-sectional data usually consists of comparing the differences among the subjects. We use time series databecause we want to see how individual athletes change over time, and how our prescriptions are affecting those changes. The trajectory is the line formed when you connect time series data points (see the graph to the right). The trajectory shows how a given variable changes over time. The Sparta movement signature is made up of three variables (LOAD, EXPLODE and DRIVE). The key to knowing if our prescriptions are affecting the variable we are trying to change is to isolate that variable, it has to be the only thing that changes. The prescription has to stay the same, or remain fixed, otherwise we’ll have no idea if a given prescription had the desired effect.
Practical Applications
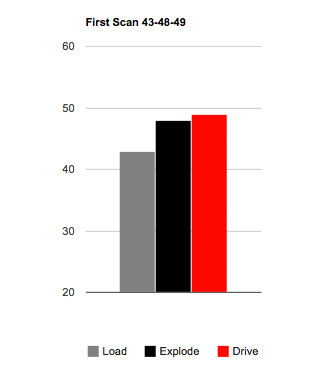
An athlete completes our scan and the Sparta signature (on the right) shows that they need to improve LOAD. We prescribe heavy squats because our data has shows that it is proven to improve LOAD. How long does the athlete have to repeat this prescription before we can measure its affect? The statisticians we work with say that a minimum of 3 cycles need to be completed to make an accurate correlation. Traditionally, “cycles” have been a calendar week, but we have found that anywhere between 5 and 8 days can constitute an effective cycle. This means that the athlete needs to repeat the prescribed movement (squats) for at least three cycles of 5-8 days before we can test its effect on LOAD. If we were to change the prescription prematurely, before the athlete had completed three cycles, then any changes to LOAD in a subsequent Sparta signature scan could not accurately be attested to our prescription of squats.
Furthering the Case for Consistency
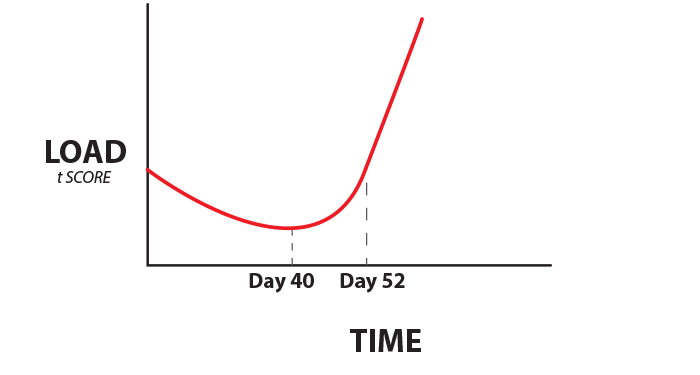
In analyzing our athletes’ data, we have made a surprising discovery. Our athletes actually get worse before they get better. In addition, the amount of time it takes for our athletes to improve after this initial decrease in performance is startling similar. The graph above shows how the t scores for LOAD changed over time for one of our athletes. This athletes’ initial signature indicated that they needed to improve LOAD so we implemented our prescriptions accordingly. As you can see, the t scores for LOAD actually decreased over time until reaching their lowest value 40 days into the training cycle. Then, at around 52 days the t score for LOAD was equal to the athletes’ initial scan. After that, LOAD increased steadily over time. The amazing thing is that as we analyze our athletes’ data, they ALL look like this. The time it takes for a given Sparta signature variable (LOAD,EXPLODE, DRIVE) to change follows this pattern almost exactly. The variable decreases until reaching a low point at about 40 days, regains it’s starting position at day 52, and then rises steadily after that. The key to understanding this information is to remember that over this period of time, the athletes’ exercises DO NOT CHANGE. They repeat the same training cycle until we see the variable (in this case LOAD) improve enough to the point that improving other variables takes precedence. Certainly the loading schemes can change, but if we were to change our training prescriptions at some point in this cycle we wouldn’t be allowing the athlete enough time to adapt to the training and then to make any significant improvements. Along the way, the athlete invariably feels bad, is discouraged and disappointed. Having the patience to stay consistent, and the evidence to back it up, is what gives us the opportunity to make a lasting changes to our athletes’ signatures and improvements in their performance on the field or court.