

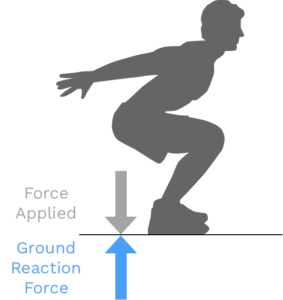
Force plates, also referred to as force platforms, are relatively simple pieces of equipment and have been around for decades. The first commercially available force plate system in use in a biomechanics laboratory was in the mid 1970’s, and they have remained a mainstay in biomechanics labs ever since. We often explain the force plate as an extremely sensitive bathroom scale, as it is ultimately based on the same principles derived by Sir Isaac Newton in his early experiments on force and gravity.
At the simplest level the force plate allows us to measure Ground Reaction Forces. These are the same forces Newton taught us about in his 3rd law, for every action there is an equal and opposite reaction, and are ultimately the forces responsible for human movement or motion. Force plates can have different numbers of sensors that can provide more or less granular data.
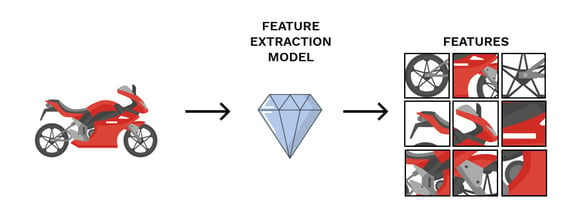
From the four sensors in the Sparta Science force plate, data is collected one thousand times per second (1000 Hz) and is ultimately resolved into vertical force and center of pressure (CoP). So for each millisecond, three different pieces of data are generated (i.e. 3 degrees of freedom): resultant vertical force (Z), CoP coordinate in x plane (X), CoP coordinate in y plane (Y). This data is most commonly referred to as time-series data, and in its “raw” form isn’t of much immediate utility, which is why different softwares and systems derive (extract) different metrics (features) from the time-series data that may be of more interest and use to scientists, researchers, and hopefully practitioners and organizations.
What’s with the jargon?
This may all be information you generally are aware of, but you may be seeing a few new terms that are worth explaining. The terms extract, and feature can be thought of similarly to derive, and metric, respectively. This terminology is more commonly used in the machine learning community and thus is a bit more accurate when discussing how we utilize force plate data here at Sparta Science.
Extracting Features: Now and Forever
The majority of software programs paired with force plates derive or calculate (using calculus derivatives based on principles of physics) different force plate metrics to provide users with more easily interpretable information than the time-series data provides. For example, some researchers may have a good understanding of how concentric rate of force development is calculated from a countermovement jump, what typical ranges are for their subjects, and what that metric may represent.
Similar to other software, the Trinsic human data platform (HDP) Sparta Science is built upon also extracts features from the time-series data utilizing physics-driven principles and provides them after the completion of a scan (force plate assessment). However, it additionally stores all of the raw time-series sensor data in a secure data lakehouse as part of the HDP ecosystem. This allows us to continuously extract new features from historical data and use them in analysis and modeling. So if there is a new feature (metric, variable, etc) of interest, utilizing a machine learning pipeline we are able to extract this feature from previous data collection and utilize it in analysis, research, and model development.
This is not only a huge benefit for researchers whose constant challenge is recruiting more and more subjects for studies but for organizations that are investing in better leveraging data insights. Only through leveraging a platform is one able to extend the lifespan of data, allowing continuous learning and insights through the use of machine learning.
I just jumped 65 inches!
It is important to understand that all of these physics-derived metrics are calculated, not measured directly. Therefore:
- There is the possibility of error in these calculations
- These metrics simply allow us to better interpret information from the time-series data by viewing the data through a physics-based lens.
Using the time-series data to derive physics-based features accurately can actually be a quite tricky process. The calculations themselves are relatively simple, however, if there are quality issues with the underlying time-series data this error can be magnified, making the results of our calculations off. Sometimes, way off.
We will use two different but related features to explain: Jump Height (from impulse) and Jump Height (from flight time). Both of these features calculate Jump Height utilizing two different methods, which give us slightly different but usually close answers. When the quality of underlying time-series data is suspect, however, we can get some pretty wonky results! For example, in one data set, we saw an individual with Jump Height (flight time) as 27 inches yet a Jump Height (impulse) as 65 inches! While displaying a 65-inch jump is an obvious error in calculation, the underlying problem is real. At least in this case, we cannot assume that the other calculated metrics are correct either… and what about last time? … and next time?
In real-world settings, this can be difficult as athletes, patients, and soldiers can quickly lose trust in the accuracy of or value of technology.
Feature Extraction ≈ Smart Calculation
Because we have years of stored time-series data, our data scientists and developers have been able to iterate and improve on the standardization of our scan protocols to ensure that data is collected in a reliable fashion and features are extracted accurately. In this context it is easy to think of the difference between extraction and calculation in that extraction is simply a “smart calculation.” Not only are we performing the physics-based calculation, but with the depth of data we have we are able to deploy machine learning models directly to our Scan app that make sure to filter time-series data for quality and accurately perform the calculations.

So when a calculation does go awry, the question may be: “how do we correct these calculations in our data?” Well first, if the time-series data is gone (often this is not stored) you may not be out of luck! As is often said in data science “garbage in, garbage out,” if the quality of the data is bad there is often not anything that can be done. If the time-series data exists, then oftentimes well-trained data scientists can investigate the time-series data itself to look for what may be causing the calculation error to see if it can be resolved. In some cases, if the quality of time-series data itself is compromised, it isn’t possible to correct the calculations (bad data).
Anyone who has used the Sparta Scan App is aware that at times the software itself will “reject” a scan trial and ask the user to perform another. This is for this exact reason! While the time-series data is still stored in our data lake for further investigation (and further improving our smart calculations), we only allow the data that we are confident is accurate to be displayed in the platform.
Though the extraction process is robust and based on many years of collecting and evaluating time-series data, there is always room for improvement. We can continuously update and deploy new models to improve our ability to extract reliable features (both physics-driven and machine-learning-driven) directly to our platform and into our customers’ hands. This enables us to immediately apply new learnings directly to practitioners without having to wait for the extremely slow, albeit important, learnings that come from prospective studies published in academic journals.
Can you fix my data?
If a customer does notice any data that seems suspect to a calculation error, they are instantly able to flag this data to alert our trained data scientists and machine learning engineers to investigate the anomaly. We are able to learn from these and improve our extraction techniques to get the correctly calculated metric in the platform and ensure that incorrect calculations stay out! This is very technical work which is not something that just anyone can do, and definitely not something we allow our customers to do themselves on our platform.
In research settings, there is no standardized approach to how to treat these. In fact, most researchers conclude that a standardized approach for collecting, analyzing, and storing this data is needed. Some researchers attempt to correct these calculations themselves using their data acquisition software, others leave them as is and analyze, and still others simply ignore them as “outliers” and continue on with data analysis.
Allowing individual users (yes, even researchers) to subjectively tinker with these calculations puts the responsibility of data standardization into the hands of each individual data collector who can make different and often arbitrary decisions. For small local data sets, this may not be an issue, but since this data is most valuable when aggregated in large volumes and analyzed utilizing machine learning this is actually of great concern. We are never going to get to a broad standardized approach that folks can use (as all research suggests) without starting somewhere. Is our standardized approach perfect? No, but we have one.
Physics-Driven vs Data-Driven Features: A teaser for a future discussion
The second point on calculated metrics listed above (and in italics below) is a bit more abstract. But because we don’t want to lose your attention, we’ll leave you with a few words to get you thinking…
These metrics simply allow us to better interpret information from the time-series data by viewing the data through a physics-based lens.
In other words, all of the insights or information that we can learn from the hundreds of different metrics that can be calculated from the time-series data, also exist in the time-series data all by itself. And instead of using physics-driven derivatives of the time-series data to determine what ‘metrics’ are of most importance, we can also use machine-learning approaches to determine what data-driven features are of most utility. Feeling lost? Don’t worry, we’ll dive deeper into this topic in a later post.
The Take Home
Whether we use the terms ‘deriving metrics’ or ‘extracting features’, it is important to understand that there is actually a whole lot going on under the hood to even just calculate a physics-derived metric accurately. In fact, we continue to hear from researchers we work with as they learn more about our approach and force plate data itself, that they initially underestimated the complexity of collecting and analyzing this data. But if your data is stored locally and you’re tinkering with it that’s fine, just be aware that the lifespan of that data is limited, and its accuracy may be too.
Other posts you might be interested in:
View All Posts
Featured
3 min read
| April 24, 2024
Trinsic Human Data Platform: An Expansion of the Sparta Software Corp
Read More
Data
5 min read
| September 20, 2023
Decoding Babel: How Data Science Can Forge Shared Understanding
Read More
Data
2 min read
| September 19, 2023